A couple days ago I installed gstack: Garry Tan's exact Claude Code setup. The install went fine. In a fresh session, baseline context was already large before I sent anything: skills, tools, and MCP plugins load by default. That matches how the stack is meant to work, but the upfront token cost was obvious in a way I had not really looked at before.
That stuck with me.
Context size has become the thing I think about most when working with AI coding agents. Not the model, not the prompt. The context. Every tool call, every file diff, every injected layout: it all adds up, and the moment a session starts going sideways, you can't easily trace back to what tipped you over.
The problem is: the agents don't really tell you.
Cursor shows you shapes, not names
Cursor recently shipped a context visualization panel. It's a good start: you can see blobs of what's in your composer context, roughly categorized. But when I looked at it, I couldn't answer the question I actually wanted answered: which specific files, tools, and rules are loaded right now?
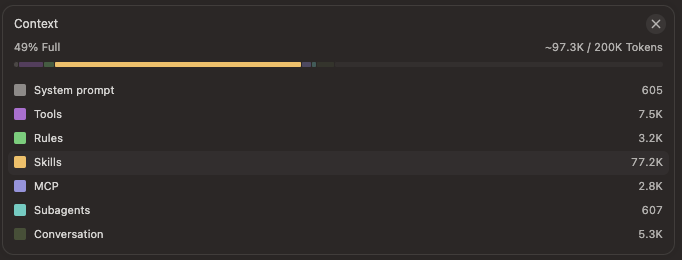
The visualization gives you approximate sizes and broad categories. What it doesn't give you is a named list of everything that got injected. Rules may land as a category, but not which files under .cursor/rules (or other rule sources) actually contributed. If there are skills loaded, which ones? If there are web references, how many? If diffs are injected, from which files?
I wanted more. The rest of this post is what I found by reading agent data off disk, and the experiment that followed: Context Mate, a local dashboard meant to go deeper than the stock UIs. Spoiler: it only partly worked. I am writing it up anyway because the gap between what you need to know and what you can actually see is the whole story.
Each agent leaves traces
I knew each agent writes to a home folder. ~/.cursor for Cursor, ~/.claude for Claude Code, ~/.codex for Codex. That's public knowledge. What I didn't know was what was actually in them that might be useful.
So I started digging.
Cursor stores its state in a SQLite database: ~/Library/Application Support/Cursor/User/globalStorage/state.vscdb. The schema is completely undocumented. After some poking around, I found a key pattern under cursorDiskKV: entries prefixed with messageRequestContext: that contain serialized snapshots of what was loaded for each composer session.
Each snapshot breaks down into named buckets: webReferences, diffsSinceLastApply, projectLayouts, knowledgeItems, and a few others. The unit is bytes (serialized size, not token count). Not ideal for comparison, but better than nothing. You can at least see which bucket is dominating for a given session.
sqlSELECT key, length(value) as size_bytes FROM ItemTable WHERE key LIKE 'messageRequestContext:%' ORDER BY size_bytes DESC;
Claude Code is a different story. It writes JSONL transcripts to ~/.claude/projects/, one file per conversation. Token usage is right there per turn. But more importantly: Claude Code is genuinely more transparent about what it loads. It surfaces which skills are active, which MCP tools are available, which plugins are installed. The gstack moment that kicked off this whole project was fully legible in Claude Code: I could see exactly which skills had loaded and understood why my context was heavy before I'd typed anything.
That asymmetry (Claude Code being explicit, Cursor being opaque) is the real finding here. It's not a quality judgment. It's a transparency gap.
Codex (OpenAI's agent) uses a SQLite database too, though the schema is less settled. I added best-effort support for it, but it's the least reliable of the three (I don't use Codex that much).
The normalization problem
Once I had the raw data from all three agents, I ran into an obvious issue: you can't directly compare bytes (Cursor) to tokens (Claude Code). They're measuring different things. Cursor's snapshot size tells you how much data was serialized, which roughly correlates to context pressure but isn't the same as token count. Claude Code's token count is more precise but doesn't map onto what Cursor is doing under the hood.
I did not try to invent a single synthetic token score that pretends those units are the same. Context Mate still tries to give a unified view of conversations, with usage grouped by project and each session tagged with the agent that produced it. Cursor and Claude Code report in their native units. That honesty was the right call, but it also meant the experiment stalled on usefulness: I could see the shape of work across agents, yet I still could not translate that into one actionable model of "context pressure" or close the gap to what I wanted from Cursor (named sources, not buckets).
Context Mate: the experiment
Context Mate is what I built to push past vendor summaries: a local Next.js dashboard that reads your own agent data and lays it out in one place. The goal was to dig deeper into context usage across agents, not to ship a polished product.
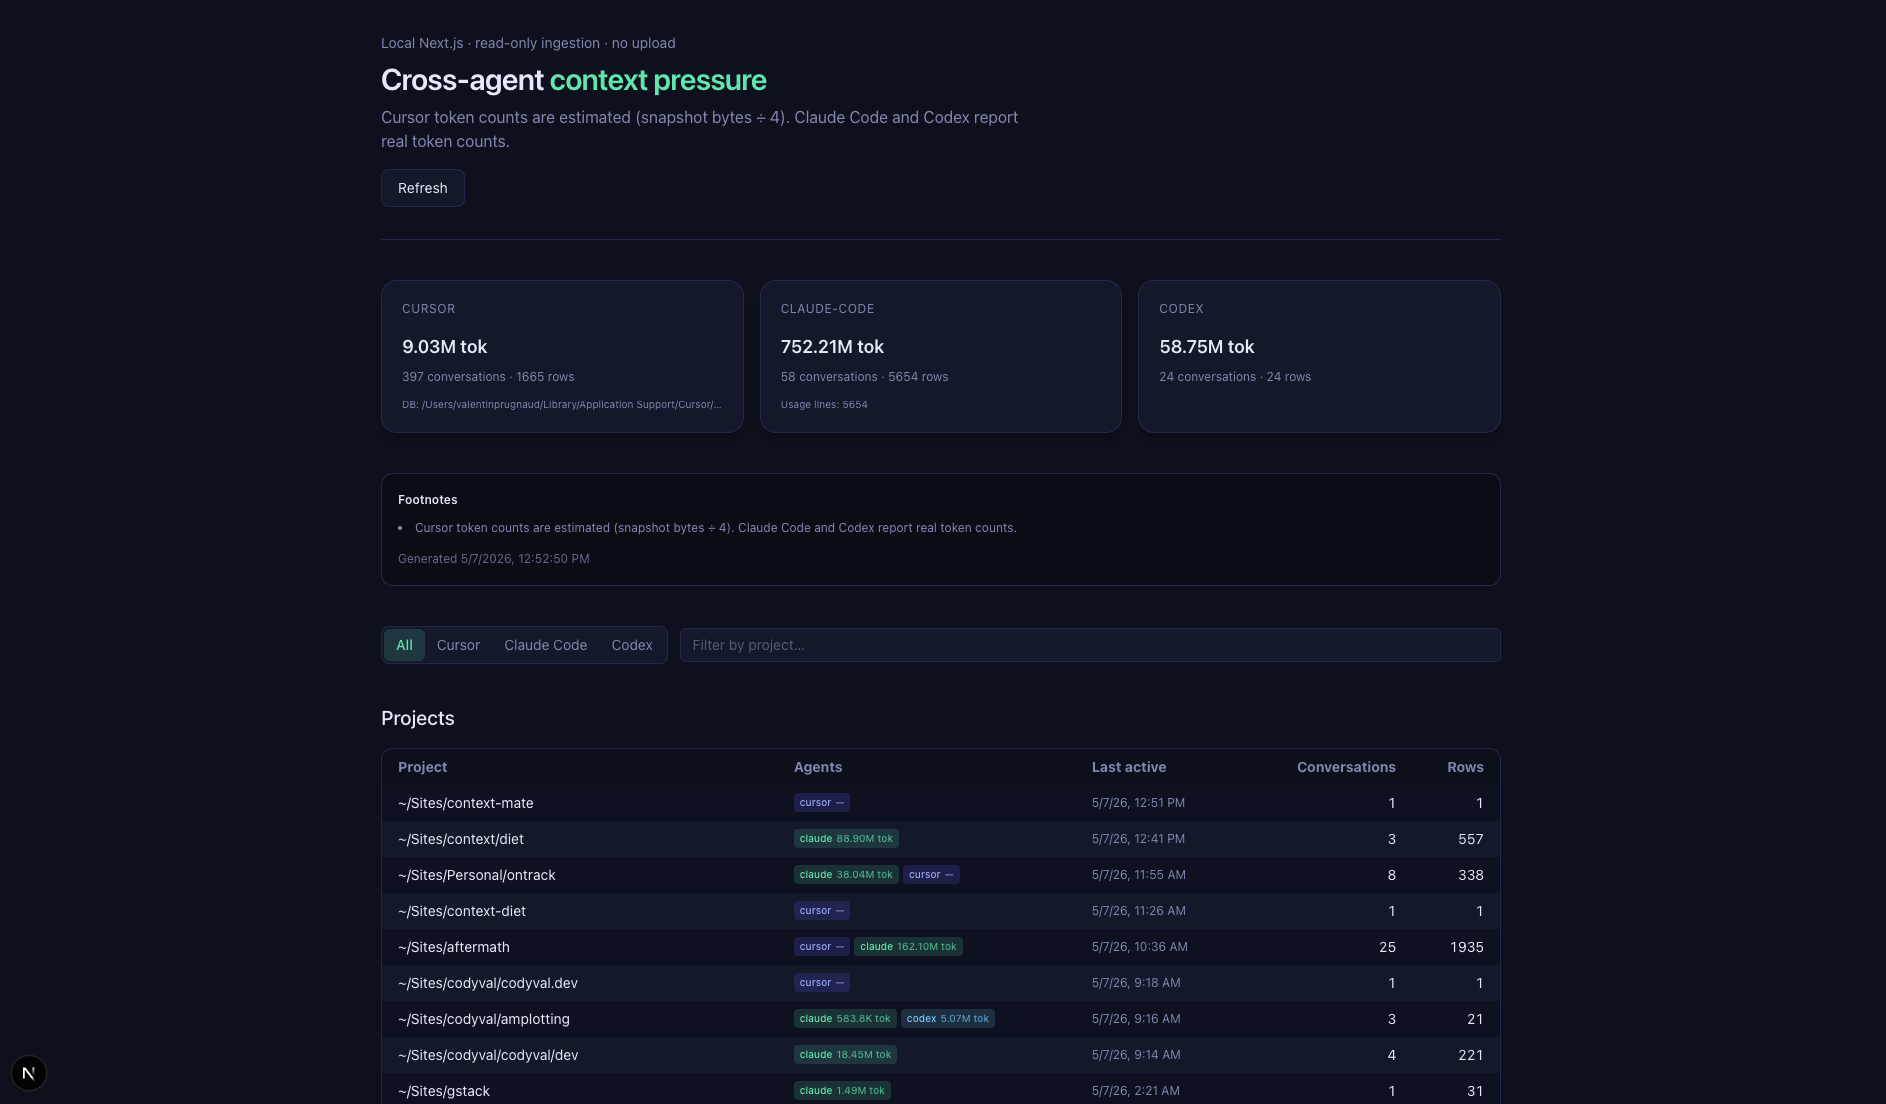
bashpnpm install pnpm dev
Open localhost:3000 and you get a unified view across all three agents: conversations, per-project usage, and which agent produced each session. Each Cursor composer shows its snapshot buckets and their relative sizes (coarse signal, not a file-by-file ledger). Each Claude Code conversation shows token usage per turn. There's a /api/context endpoint if you want to pipe the data somewhere else or snapshot it over time:
bashcurl -s 'http://localhost:3000/api/context?redact=1' -o report.json
A few things to know before you run it: Cursor's schema is undocumented, so read the DB while Cursor is idle or copy state.vscdb* first. Bytes and tokens aren't comparable; the dashboard shows both on their own terms and doesn't try to convert between them. Codex support is best-effort. Any of this can break when Cursor changes storage, which is part of why I consider the experiment unsuccessful so far as a dependable tool, even when it is occasionally illuminating.
What I actually learned
The gstack installation was the clarifying moment. It loaded a lot into context by design, but I had no way to see it in Cursor. Claude Code showed me exactly what was in there; Cursor showed me a shape.
Context management is quickly becoming a skill of its own, separate from prompting, separate from model selection. Which files you let into your context, which tools you keep active, which rules fire automatically: all of it shapes how your agent behaves, and none of it is visible by default.
You can't improve a loop you can't observe. Context Mate was my attempt to widen that loop for myself. It helped confirm where the traces live and how asymmetric transparency is across agents. It did not get me to a stable, named inventory for Cursor, or to a single honest metric I could trust across agents. So far, that is a failed outcome relative to what I set out to do, even if the repo is a useful starting point for someone else to push further.
The answer I can stand behind today: there is more in the window than Cursor makes legible, and my experiment only chipped at the surface.
- AI Coding Agents
- Cursor
- Claude Code
- Context Engineering
- Developer Tools
